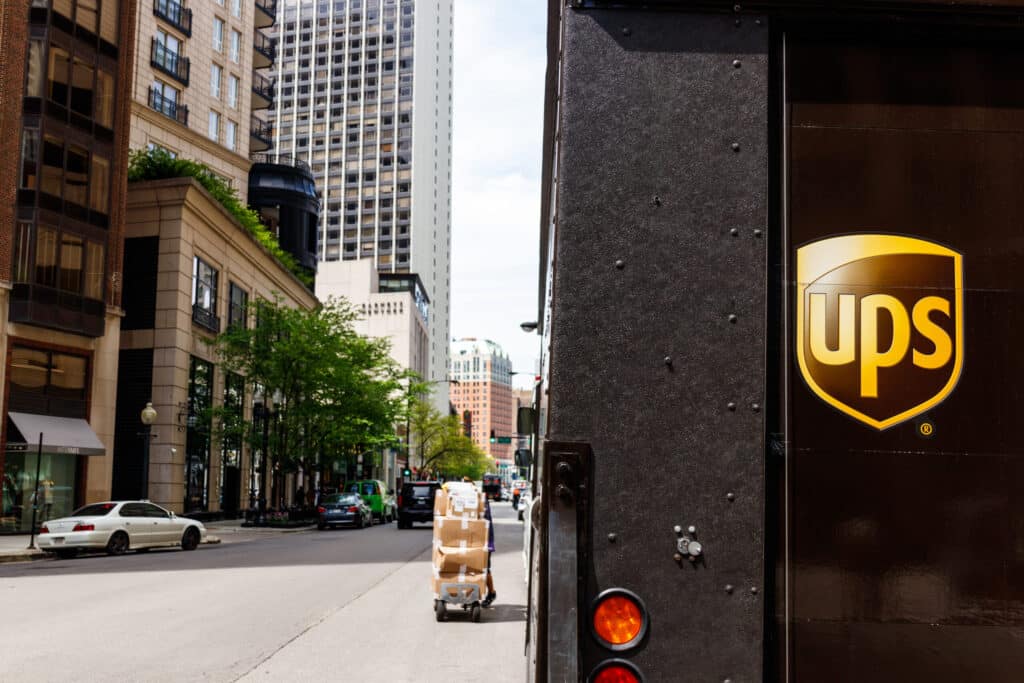
How to Use Effective Analytics for Controlling Your Parcel Spend

Parcel Spend

Shipping is constantly changing, from customer expectations to carrier rates to new technologies. For most shippers, it’s a challenge just to keep up. Understanding the details of how each change impacts your bottom line might feel out of reach.

But one result of all this change is that shippers now have access to more information about parcel shipping, and specifically their shipments, than ever before. It may be trapped in invoices or in carrier software, but it’s there. And most if it is available to you.

Data is powerful for those who know how to harness it. Descriptive analytics allow shippers to monitor their performance in real or nearly real time and continually evaluate their shipping strategies. Prescriptive analytics project potential futures, giving shippers the power to understand the potential impacts of new products or rate increases.

Are you leveraging analytics to understand your shipping needs and control your parcel spend? If not, let’s get started today.

What types of analytics are available?

Analytics have two key functions: Describing the current state of things and predicting what might happen in the future.

First, there are “descriptive analytics.” These data help shippers assess what their shipping profile (and parcel spend) has looked like in the past. For example, descriptive analytics might include information about how much you spent on various service types, how much you spent on accessorial charges, and how much holiday shipping cost last year.

The more information you have, the more useful descriptive analytics become. Once you grow from three months of data to a year of data, you can understand seasonal trends. Once that data set expands to include multiple years, you can understand the impact of carrier fee increases or the launch of a new product line.

Then there are “prescriptive analytics.” This is a higher order of information that helps you understand not just what happened, but what might happen in the future.  

Prescriptive analytics leverage all that descriptive information gathered above to help you make predictions. For example, say you’re planning for the launch of a new product. You’ve designed custom packaging and know its approximate weight. You should be able to calculate the cost of shipping each parcel to each zone.

By synthesizing sales predictions with shipping data, you can figure out how much you’re likely to spend shipping that new product in its first month or its first year. This can help with pricing, budgeting, and decisions about special offers, like free or flat-rate shipping.

What are KPIs?

KPI stands for “key performance indicator.” These typically refer to specific data points that shippers can gauge to assess their performance, highlighting opportunities for savings and problems that need to be addressed immediately.

One common KPI is cost per shipment or cost per unit weight. All retailers and manufacturers want to sell more products. But increasing volume on a product that has a high cost per shipment isn’t as good for your bottom line as increasing volume on a product with a low cost per shipment. The higher the cost per shipment, the smaller the margins are.

Cost per shipment isn’t necessarily a simple number, though. It is calculated from a bunch of other data: Service type, service level, zone, fuel surcharge, other applied surcharges, and more. You need to track all these data points in order to generate a meaningful cost per shipment measurement.

And when you seek to reduce shipping costs on the products with the highest costs per shipment, you’ll need to dig into these component parts to figure out what to change.

How can we collect quality data?

There’s no shortage of data available to most shippers. Invoices are rich data sources, for example. But for businesses with global networks, many suppliers, or many distribution points, data sources don’t always sync nicely with each other. The challenge is to present that data in a way that supply chain leaders can actually use.

Data collection programs must consolidate all that information in one central place. They clean and normalize the data to make sure of its accuracy. If the raw data isn’t clean, the analytics it generates won’t be useful.

The best data collection programs also provide next-level support. They track specific KPIs, not just the data underlying them. They allow managers to set targets for each KPI and offer updates on progress toward those goals. Sophisticated programs can spot impediments to that progress and utilize KPIs and sub-KPIs to perform root cause analysis of the problems.

Finally, great data management programs offer “business intelligence.” They not only offer insights not only into shipping costs, but generate strategies for optimizing your parcel spend to align with your broader business priorities.

Controlling your parcel spend starts with good information — raw data that accurately describes how your goods are moving and how much it costs. To leverage the power of that data, you need key performance indicators that synthesize some of that data and offer insights into how that money is spent.

Finally, you need to turn those insights into actionable intelligence. Great data collection software can support supply chain leaders by alerting them to inefficiencies and solving complex optimization problems. And expert consultants can help managers interpret software-generated conclusions on a more human level.

Are you seeking advice about leveraging analytics to control your parcel spend? Let Reveel help. Reach out today to learn more about how we can support you.

Sign Up - Free